The distribution of wealth in any country is a topic of considerable interest. How much of the wealth is owned by the top 1% (i.e. the wealthiest citizens)?
This visualization uses a bar graph to illustrate the way wealth was distributed in the United States in 2007. It compares the amount of wealth owned by five groups of citizens. The goal is to show the huge imbalance between the wealthy and everyone else.
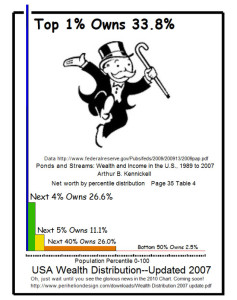
Image Source: http://gizmodo.com/8-horrible-data-visualizations-that-make-no-sense-1228022038
Questions for Students
1. What message does the chart convey? What can you conclude about the 1% of the wealthiest citizens?
2. What are some things you think are good about the visualization? Why?
3. Are there things that make the chart confusing? Why? What can be done to improve it?
4. Consider all the text in the chart. Does it tell a coherent story?
5. Overall, is this a good or bad visualization? Why?
6. The information given in the visualization above is from 2007. Look up more current data and design a visualization to represent the information given. Think about what aspects of the data you want to highlight. How can this be done best?
Discussion
One’s first impression is one of a cluttered visualization. Lots of space is taken up by the image of the rich man from the game Monopoly. Is he important to the story the image tells? There are many distracting elements in the image, including the advertisement of the 2010 chart. The actual information lies in the bar graph, which is almost crammed into the corner, getting lost in the clutter. The x-coordinate shows five groups of citizens while the y-coordinate shows the amount owned by each group. The width of a bar indicates the percentage of the population, and the height represents the percentage of total wealth they own. When this is understood, we can see that the highest bar is also the thinnest. One gets the message that “a few have a lot.” But overall, the visualization fails in getting the message across clearly. The most relevant information seems to be the text next to each bar. If that is the case, why do we even need a visualization?
