To relate the Simulations section to the section on Information Security, we include a NetLogo example that simulates the spread of a virus on a network. In a real network, there are many factors involved in the spread of a virus. For a virus to spread from one machine to another, there obviously must be a connection between the two, but other factors include whether or not the machine is vulnerable to said virus or not. When considering a network as a whole, we need to look at the possibility for recovery from infection and the possibility of making a machine resistant to the virus.
NetLogo provides a simulation that shows the spread of a virus through a network, based on these parameters.
- Select File > Models Library, and then Sample Models > Networks > Virus on a Network.
- Students can control the following parameters:
- Number of nodes (i.e. number of machines in the network)
- Average node degree (i.e. average number of connections per machine)
- Initial outbreak size (i.e. number of machines initially infected)
- Virus spread chance
- Virus check frequency
- Recovery chance
- Gain-resistance chance
- When the setting is done, click the SETUP button and then the GO button to start the simulation.
- Use the Info tab in NetLogo to get more information of this example and ask students to discuss how the model works.
- Discussion:
- Ask students to try several different settings and make observations about the results. We suggest doing several simulations varying only one or two of the more interesting parameters to see their effect on the results. Notice that the resulting graph shows the number of infected, vulnerable, and resistant machines over time. Ask the students to look at extreme examples (e.g. 0% chance of recovery, etc.) to see how the results change.
- Network viruses can behave (especially in a simulation) similarly to human viruses. What are some of the factors they have in common? What are some factors that are different? Ask students if they think these two events would behave similarly in the real world. If so, how would the factors relate to each other? If not, what are some factors that would be different?
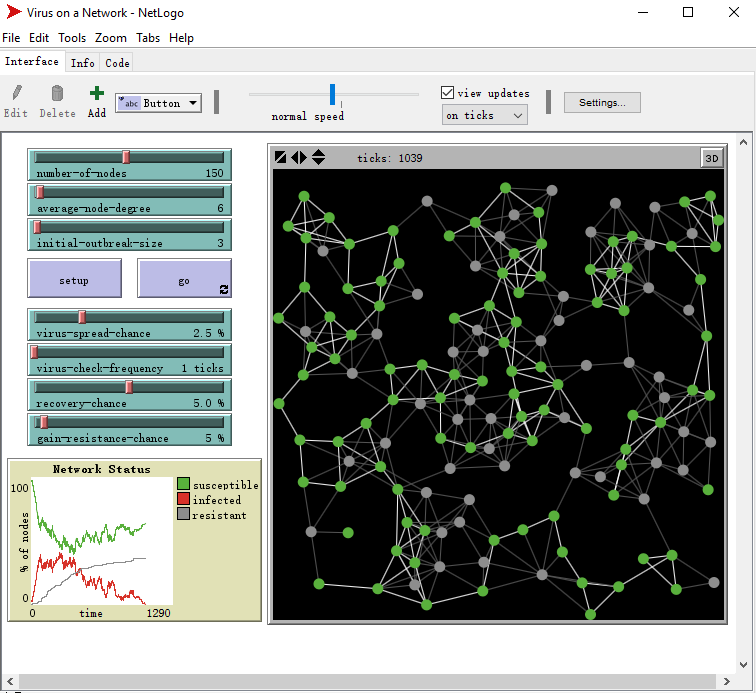
Figure 1: Virus on a Network Simulation Result
Other Resources about Computer Virus Simulations:
- This link is a lab about a virus simulation. Although we have not tested the simulation, it may be interesting to look at the different parameters involved and the graph showing some results.
- http://www.securityweek.com/ is an online magazine devoted to real-world information security.
