The physical distribution and movement of two or more groups into different neighborhoods is in some scenarios driven by individual choices. These choices result in neighborhoods having certain features. In almost all such applications, it is difficult to mathematically prove any arising properties. However, simulation and modeling provides interesting and relevant insight.
The most commonly mentioned segregation example is related to residential housing and involves two groups. Decades ago, the US government realized that residential segregation produces negative socioeconomic outcomes for minority groups and implemented policies to promote integration. Success was much harder to achieve than expected.
In the 1970’s, the economist Thomas Schelling created an agent-based model to help explain why segregation is so difficult to combat. Schelling received the 2005 Nobel Prize in Economics for his contribution in the area of “conflict and cooperation through game-theory analysis.” Schelling’s model of segregation showed that even when individuals didn’t mind being surrounded or living by members of a different group, they would still end up being segregated from others over time! Although the model is quite simple, it gives insight into the actions of individuals that lead to segregation, even when they have no explicit desire to contribute to it.
NetLogo provides one model that simulates the segregation process.
- Select File > Models Library, and then Sample Models > Social Science > Segregation.
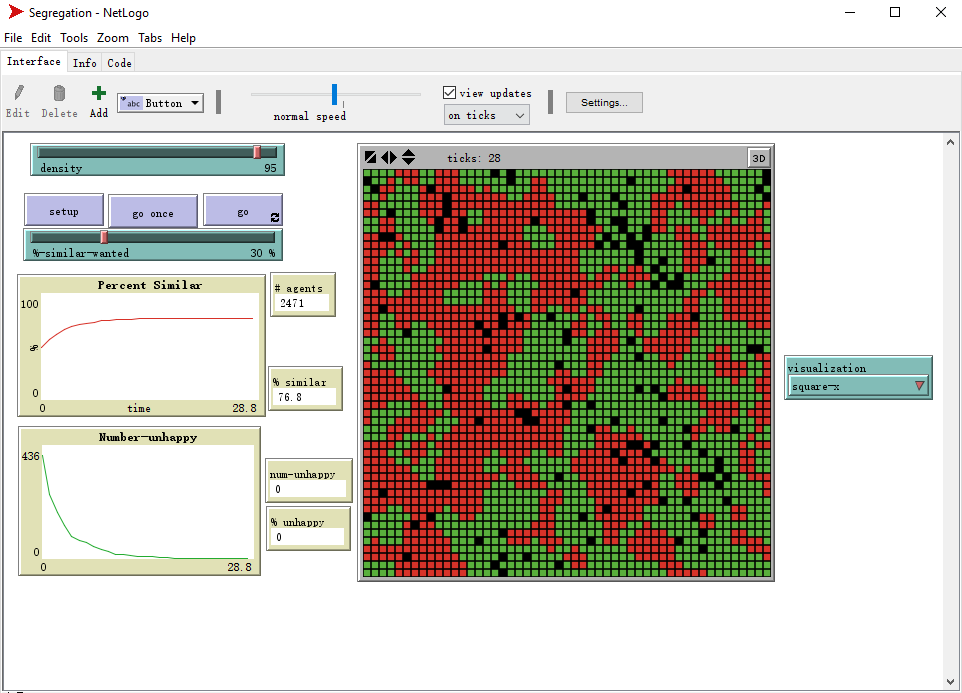
- After the project is open, students can control two parameters:
- Population density
- Percentage of desired similarity (e.g. 30% if each red square wants to be surrounded by at least 30% red squares)
- When the setting is done, click the SETUP button and then the GO button to start the simulation.
- Use the Info tab in NetLogo to get more information of this example and ask students to discuss how the model works.
- Discussion: Ask students to try several different settings and make observations about the results. Notice that the results of the experiment give several pieces of information, including:
- The percentage of similarity (i.e. segregation)
- The percentage of people who are unhappy
- How long it takes to get there (to 0% unhappiness)
Other Resources about Segregation:
- Additional information on Schelling’s Model of Segregation
- http://ncase.me/polygons/ provides a playbale post on the shape of society and stresses that small individual biases can lead to large collective biases.
- https://en.wikipedia.org/wiki/Residential_segregation addresses policies and trends related to residential segregation, including insight into segregation models that are not race related.
